
D&D Race/Class Combos in ~1 Million Character Sheets
Last year, I scraped data from more than 1 million D&D character sheets from online sources, storing them in a SQLite database. The project was both for my own curiosity, and because I wanted to get some more hands-on practice using SQL. Just storing the data required learning how to use SQLAlchemy, which was worth the time on its own.
Anyways, now I have a big database of D&D characters, from which you can extract all sorts of fun insights. This notebook shows the most common race and class pairings.
import sqlite3

import pandas as pd
import numpy as np
import seaborn as sns
from matplotlib import pyplot as plt
# Connect to the database
con = sqlite3.connect("../../db/main_11-30-21.db")
The query below extracts just the class and race from each character. Due to the way the data was coded, a case statement is necessary to disentangle subraces. It also filters out homebrew classes and class names that contain a parenthesis, which are usually unearthed arcana classes, designated by (UA).
query = '''

SELECT
    classes.charId AS charId,
    classes.classLevel,
    cd.className,
    CASE
        WHEN r.isSubRace = 1 THEN
            baseRaceId
        ELSE
            r.fullName
        END raceName

FROM classes
    LEFT JOIN characterSheet cs ON classes.charId = cs.Id
    LEFT JOIN race r ON cs.raceId = r.Id
    LEFT JOIN classDefinition cd ON classes.classDefinitionId = cd.Id
WHERE
    cs.raceID IS NOT NULL
    AND r.isHomebrew = 0
    AND cd.isHomebrew = 0
    AND NOT raceName LIKE '%(%'
ORDER BY charId;

'''
df = pd.read_sql_query(query, con)
df
| charId | classLevel | className | raceName | |
|---|---|---|---|---|
| 0 | 2510 | 2 | Wizard | Elf |
| 1 | 2778 | 1 | Warlock | Tiefling |
| 2 | 2806 | 3 | Druid | Genasi |
| 3 | 2903 | 11 | Monk | Elf |
| 4 | 2988 | 1 | Monk | Dragonborn |
| ... | ... | ... | ... | ... |
| 1041035 | 52414131 | 6 | Paladin | Half-Elf |
| 1041036 | 52414131 | 9 | Sorcerer | Half-Elf |
| 1041037 | 52414131 | 5 | Warlock | Half-Elf |
| 1041038 | 52414159 | 18 | Druid | Warforged |
| 1041039 | 52414174 | 1 | Rogue | Aarakocra |
1041040 rows × 4 columns
There are more rows than unique characters. This is because of multiclassed characters, which get a row for each unique class. I’ll leave the data as-is and count each unique class for each character a separate time.
len(df.charId.unique())
928135
We’ll limit ourselves to just the 12 most common races and classes, for a more manageable visualization.
n = 12
class_filter = list(df.className.value_counts()[:n].index)
race_filter = list(df.raceName.value_counts()[:n].index)
df = df[df.className.isin(class_filter) & df.raceName.isin(race_filter)]
df
| charId | classLevel | className | raceName | |
|---|---|---|---|---|
| 0 | 2510 | 2 | Wizard | Elf |
| 1 | 2778 | 1 | Warlock | Tiefling |
| 2 | 2806 | 3 | Druid | Genasi |
| 3 | 2903 | 11 | Monk | Elf |
| 4 | 2988 | 1 | Monk | Dragonborn |
| ... | ... | ... | ... | ... |
| 1041032 | 52414003 | 1 | Rogue | Elf |
| 1041034 | 52414055 | 6 | Barbarian | Dragonborn |
| 1041035 | 52414131 | 6 | Paladin | Half-Elf |
| 1041036 | 52414131 | 9 | Sorcerer | Half-Elf |
| 1041037 | 52414131 | 5 | Warlock | Half-Elf |
853527 rows × 4 columns
To get counts of race-class pairings, pd.crosstab() can do the trick. Then I’ll express each value as a proportion of the total, then sort the columns by column sum and rows by row sum.
tab = pd.crosstab(df.className, df.raceName)
tab = tab / tab.sum(axis=0).sum()
tab = tab[tab.sum().sort_values(ascending=False).index] # order columns
tab = tab.loc[tab.sum(axis=1).sort_values(ascending=False).index] # order rows
tab
| raceName | Human | Elf | Half-Elf | Tiefling | Dragonborn | Dwarf | Halfling | Half-Orc | Aasimar | Genasi | Goliath | Gnome |
|---|---|---|---|---|---|---|---|---|---|---|---|---|
| className | ||||||||||||
| Fighter | 0.046209 | 0.013641 | 0.007308 | 0.004413 | 0.012009 | 0.012068 | 0.003273 | 0.009552 | 0.003289 | 0.004169 | 0.008568 | 0.002104 |
| Rogue | 0.026011 | 0.027433 | 0.013677 | 0.010282 | 0.004773 | 0.002703 | 0.014878 | 0.002392 | 0.002129 | 0.004376 | 0.001277 | 0.005129 |
| Wizard | 0.023684 | 0.021548 | 0.007328 | 0.005596 | 0.004147 | 0.002791 | 0.002698 | 0.001203 | 0.002036 | 0.003606 | 0.000965 | 0.010133 |
| Barbarian | 0.014192 | 0.002970 | 0.001577 | 0.002313 | 0.009702 | 0.010622 | 0.002471 | 0.016702 | 0.001907 | 0.002701 | 0.016979 | 0.002000 |
| Cleric | 0.020795 | 0.011510 | 0.007037 | 0.004647 | 0.004334 | 0.014367 | 0.003281 | 0.002573 | 0.006887 | 0.003699 | 0.001943 | 0.002587 |
| Paladin | 0.019423 | 0.005600 | 0.007600 | 0.004853 | 0.013997 | 0.006096 | 0.001425 | 0.004592 | 0.010450 | 0.002214 | 0.004360 | 0.000935 |
| Warlock | 0.016376 | 0.008866 | 0.012703 | 0.017114 | 0.005292 | 0.001707 | 0.002131 | 0.001964 | 0.006857 | 0.003223 | 0.001224 | 0.001947 |
| Sorcerer | 0.013764 | 0.011463 | 0.012260 | 0.011004 | 0.008352 | 0.001740 | 0.002132 | 0.001201 | 0.005480 | 0.005096 | 0.000941 | 0.001823 |
| Bard | 0.014830 | 0.008661 | 0.015823 | 0.009915 | 0.003544 | 0.002742 | 0.006547 | 0.002059 | 0.003338 | 0.002853 | 0.001227 | 0.003236 |
| Ranger | 0.015950 | 0.025400 | 0.008815 | 0.003120 | 0.003666 | 0.002689 | 0.003768 | 0.002342 | 0.001547 | 0.002949 | 0.001454 | 0.002187 |
| Druid | 0.009741 | 0.019025 | 0.006246 | 0.004015 | 0.003322 | 0.003475 | 0.003380 | 0.001959 | 0.001846 | 0.005482 | 0.001582 | 0.003496 |
| Monk | 0.015640 | 0.010230 | 0.003917 | 0.002897 | 0.003794 | 0.002294 | 0.003960 | 0.002447 | 0.002225 | 0.004839 | 0.002595 | 0.001534 |
Now, let’s make a heatmap.
dims = (11.7, 8.27)
fig, ax = plt.subplots(figsize=dims)
cmap = sns.cm.rocket_r
heatmap = sns.heatmap(
    ax=ax,
    data=tab.T,
    cmap=cmap
)
title = ax.set_title('Race and Class Proportions in ~1 Million D&D Characters')
ylabel = ax.set_ylabel('Race')
xlabel = ax.set_xlabel('Class')
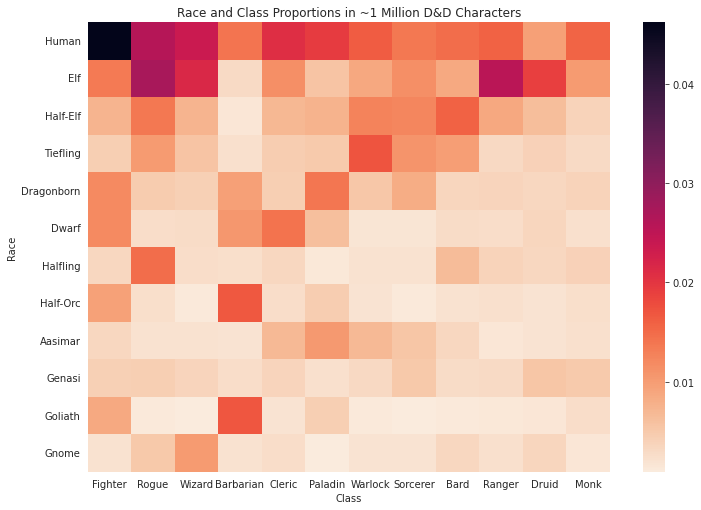
There’s a lot of fun information packed in this little graphic. For example, human fighters make up almost 5% – 1 in 20 – of all D&D characters in the dataset. Islands of heat show pairings that are especially popular: elf rogue, goliath barbarian, tiefling warlock.
Also, some races seem to have greater class diversity than others. Goliath are often barbarians and halflings are often rogues, but genasi seem more “spread out” among a variety of classes (probably due to the fact that they have a variety of subrace options).
An easy way to express this quantitatively is with the Gini index. In effect, we can measure the internal “inequality” of the population of each race.
There are a million Gini implementations out there, but I’ll use a concise one I found on stackexchange.
def gini(x, w=None):
    # Array indexing requires reset indexes.
    x = pd.Series(x).reset_index(drop=True)
    if w is None:
        w = np.ones_like(x)
    w = pd.Series(w).reset_index(drop=True)
    n = x.size
    wxsum = sum(w * x)
    wsum = sum(w)
    sxw = np.argsort(x)
    sx = x[sxw] * w[sxw]
    sw = w[sxw]
    pxi = np.cumsum(sx) / wxsum
    pci = np.cumsum(sw) / wsum
    g = 0.0
    for i in np.arange(1, n):
        g = g + pxi.iloc[i] * pci.iloc[i - 1] - pci.iloc[i] * pxi.iloc[i - 1]
    return g
Now we can just apply this along each column, and sort.
race_gini = tab.apply(gini).sort_values()

dims=(10,7)
fig, ax = plt.subplots(figsize=dims)
sns.set_style('darkgrid')
sns.set_color_codes('muted')
ax = sns.barplot(
    x=race_gini,
    y=race_gini.index,
    orient='h',
    color='b'
)
ax.set_title('Class-wise Gini Coefficient of D&D Races', fontsize=16)
ylabel = ax.set_ylabel('Race', fontsize=14)
Text(0, 0.5, 'Race')
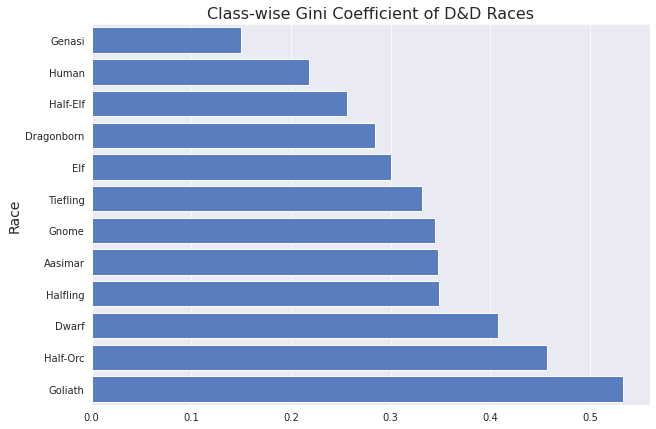
There you have it: D&D races sorted by class diversity. Genasi and humans have the most class variety, whereas half-orcs and goliaths are more homogenous.
The Goliath spot is not so surprising, though going into this I would have guessed tieflings would be more homogenous. I guess warlocks don’t dominate the ranks of tieflings as much as barbarians do for goliaths.