
‘Journals Like You Also Reviewed…’
By now, most people probably have an intuitive understanding of how a simple recommendation system works. Classical recommendation systems use what is known as “collaborative filtering”: items are recommended based on the tastes of other users who have purchased/viewed/consumed many of the same items that you have.
Although collaborative filtering was invented in the 1990s, it’s based on an older intuition about how taste works: people who have shared taste in the past are likely to do so in the future. From a sociology of culture perspective, what’s most interesting is that it even works in the first place. The fact that observed overlaps in taste can be used to uncover unseen overlaps tells us something about communities of taste and the social formation of preferences.
For the past few months, I’ve been working on a dissertation chapter that explores this perspective. The chapter applies some of the methods of the collaborative filtering literature to a dataset derived from the contents of the Book Review Index between 1965 and 2000. The full dataset contains bibliographic entries on over 3 million reviews of over 1 million books. Instead of looking at purchase history, I consider whether two books or authors were reviewed in a similar collection of journals.
In what follows, I share a simple demonstration on just the 1965-1984 section of the data. I model the data as a journal-author matrix: columns are journals, rows are authors, and each cell represents the number of times that author was reviewed by that journal. This allows us to make similarity comparisons between authors that have a remarkable degree of intuitive consistency: authors are naturally grouped by genre, status, profession, and even nationality.
import math
import time

import pandas as pd
import numpy as np
import seaborn as sns
from matplotlib import pyplot as plt

# for t-SNE visualization
from sklearn.decomposition import TruncatedSVD
from sklearn.manifold import TSNE

# for plotting, we will use Bokeh for the excellent interactive options
from bokeh.plotting import figure, show, output_file
from bokeh.models import ColumnDataSource, HoverTool, CategoricalColorMapper, Legend
The processed data tracks reviews at the level of titles. This cell instead groups by authors.
df = pd.read_csv('../../data/processed/book_reviews.tsv', sep='\t', index_col=0)
df['author_name'] = df.index.to_series().str.split('\\|\\|').str[1].str.strip()
author_total_books = df['author_name'].value_counts()
df = df.groupby('author_name').sum()
df = df[df.index.notnull()]
df = df.drop('#NAME?')
df.head()
| AB Bookman's Weekly | Publishers Weekly | Esquire | Booklist | Journal of Aesthetics and Art Criticism | International Philosophical Quarterly | Journal of Marketing | Harvard Law Review | Journal of Business Education | Journal of Home Economics | ... | Black Warrior Review | Computers and the Humanities | American Arts | Essays on Canadian Writing` | Performing Arts Review | Journal of Arts Management, Law, and Society | Studio International, Review | Journal of Black Studies | Lone Star Review | Aspen Journal of the Arts | |
|---|---|---|---|---|---|---|---|---|---|---|---|---|---|---|---|---|---|---|---|---|---|
| author_name | |||||||||||||||||||||
| 0 | 0 | 0 | 1 | 0 | 0 | 0 | 0 | 0 | 0 | ... | 0 | 0 | 0 | 0 | 0 | 0 | 0 | 0 | 0 | 0 | |
| AABERG, Jean | 2 | 1 | 0 | 0 | 0 | 0 | 0 | 0 | 0 | 0 | ... | 0 | 0 | 0 | 0 | 0 | 0 | 0 | 0 | 0 | 0 |
| AADLAND, Florence | 0 | 0 | 1 | 0 | 0 | 0 | 0 | 0 | 0 | 0 | ... | 0 | 0 | 0 | 0 | 0 | 0 | 0 | 0 | 0 | 0 |
| AAFJES, Bertus | 0 | 0 | 0 | 1 | 0 | 0 | 0 | 0 | 0 | 0 | ... | 0 | 0 | 0 | 0 | 0 | 0 | 0 | 0 | 0 | 0 |
| AAGAARD, Orlena | 0 | 0 | 0 | 1 | 0 | 0 | 0 | 0 | 0 | 0 | ... | 0 | 0 | 0 | 0 | 0 | 0 | 0 | 0 | 0 | 0 |
5 rows × 485 columns
Let’s see how much data we’re working with. By summing over the entire dataframe, we can also see the total number of reviews.
print(df.shape)
print(df.sum().sum())
(167445, 485)
968080
This method of representing the data is similar to how you might represent customer-item interactions in a simple recommender system. As in that application, we’re going to restrict the data to only authors who have received a minimum number of reviews. I’ve selected 20, because this yields a manageable number for visualization.
Additionally, I’ve dropped all journals with fewer than 25 reviews. There are only a few of them and they are mostly due to OCR errors.
auth_min = 20
journal_min = 25
df = df[df.sum(axis=1) >= auth_min]
df = df[df.columns[df.sum() >= journal_min]]
author_total_books = author_total_books[df.index]
print(df.shape)
print(df.sum().sum())
(9043, 352)
430173
This smaller dataset only keeps ~5% of the authors in the full data, but retains ~44.4% of the reviews. So a small number of authors received the large majority of the reviews in our data.
Our goal is to find authors who are reviewed in similar venues. The problem is that our venues have extremely lopsided levels of coverage. Compare the total number of reviews in Publishers Weekly to the total in Analog Science Fiction and Fact:
pw_total = df['Publishers Weekly'].sum()
an_total = df['Analog Science Fiction and Fact'].sum()
print(f'Publishers Weekly total: {pw_total}')
print(f'Analog total: {an_total}')
Publishers Weekly total: 29769
Analog total: 456
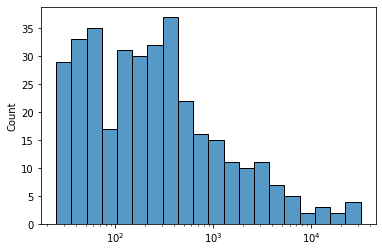
The full set of publications has a long tail: a few journals just publish an order of magnitude more reviews than the “typical” journal. The x-axis is on a log-scale because the plot is pretty incoherent otherwise.
It looks like most journals have a few hundred reviews, whereas a smaller number published a few thousand or even more than 10,000.
journal_totals = df.sum(axis=0)
review_count_hist = sns.histplot(
    journal_totals,
    log_scale=(True, False),
    bins=20
)
plt.show()
This disproportion might throw off comparisons. If Publishers Weekly, Booklist, and Choice review just about everybody, then it isn’t very informative to know that an author was reviewed by one of those journals. What we want is a number that tells us how much more an author was reviewed by a journal than other authors were.
I’ve played around with three different methods for normalizing the data in this way: standard scaling (Z-scores), TF-IDF scores, and pointwise mutual information. For this demonstration, I’m just going to use standard scaling.
from sklearn.preprocessing import StandardScaler
scaler = StandardScaler()
weighted = scaler.fit_transform(df)
weighted = pd.DataFrame(weighted, index=df.index, columns=df.columns)

weighted.head()
| AB Bookman's Weekly | Publishers Weekly | Esquire | Booklist | Journal of Aesthetics and Art Criticism | International Philosophical Quarterly | Harvard Law Review | Journal of Home Economics | Social Education | Library Journal | ... | Journal of Negro Education | Foreign Affairs | Thought | Political Science Reviewer | Mankind | Black Scholar | Social Research | Religious Studies | Daedalus | Threepenny Review | |
|---|---|---|---|---|---|---|---|---|---|---|---|---|---|---|---|---|---|---|---|---|---|
| author_name | |||||||||||||||||||||
| AARDEMA, Verna | -0.281898 | 0.873116 | -0.184596 | 1.423560 | -0.114113 | -0.048713 | -0.080852 | -0.056622 | 5.010613 | -0.652932 | ... | -0.064776 | -0.057693 | -0.038791 | -0.047681 | -0.077693 | -0.049667 | -0.052652 | -0.0555 | -0.024265 | -0.026197 |
| AARON, Chester | -0.281898 | 0.166723 | -0.184596 | 0.566514 | -0.114113 | -0.048713 | -0.080852 | -0.056622 | 2.396317 | -0.130159 | ... | -0.064776 | -0.057693 | -0.038791 | -0.047681 | -0.077693 | -0.049667 | -0.052652 | -0.0555 | -0.024265 | -0.026197 |
| AARON, Daniel | -0.281898 | -0.304205 | -0.184596 | -0.504793 | -0.114113 | -0.048713 | -0.080852 | -0.056622 | -0.217978 | -0.652932 | ... | -0.064776 | -0.057693 | -0.038791 | -0.047681 | -0.077693 | -0.049667 | -0.052652 | -0.0555 | -0.024265 | -0.026197 |
| AARON, Henry J | -0.281898 | -0.775134 | -0.184596 | -0.290531 | -0.114113 | -0.048713 | -0.080852 | -0.056622 | -0.217978 | 0.131228 | ... | -0.064776 | -0.057693 | -0.038791 | -0.047681 | -0.077693 | -0.049667 | -0.052652 | -0.0555 | -0.024265 | -0.026197 |
| AASENG, Nathan | -0.281898 | -0.775134 | -0.184596 | 7.851402 | -0.114113 | -0.048713 | -0.080852 | -0.056622 | -0.217978 | -0.914318 | ... | -0.064776 | -0.057693 | -0.038791 | -0.047681 | -0.077693 | -0.049667 | -0.052652 | -0.0555 | -0.024265 | -0.026197 |
5 rows × 352 columns
Now, we can search for a specific author and see two things:
1) their highest journal scores, that is, journals in which they are unusually prominent 2) their most similar authors, that is, authors that were reviewed in a similar collection of journals
For similarity, I’ll use Pearson’s R. You could also use a distance metric, like Euclidean distance or cosine distance. According to at least one paper, Pearson’s outperforms Euclidean and cosine for recommendations.
from scipy.stats import pearsonr

def author_query(
    df,
    author: str,
    num_journals: int = 5,
    num_authors: int = 5
    ):

    print(author)
    print('Top Journal Scores:')
    print(df.loc[author].sort_values(ascending=False)[:num_journals])
    print()

    author_vector = df.loc[author]
    similarities = df.drop(author).apply(lambda x: pearsonr(x, author_vector), axis=1)

    print('Most Similar Authors:')
    print(similarities.sort_values()[::-1][:num_authors])
    print()
Here is a somewhat arbitrary list of authors against which to make comparisons. I find the results really fascinating; you can get a taste of cleavages within the data along axes of genre, race, status, and politics. Remember that this is based on nothing other than the fact that these authors tended to be reviewed in similar journals. This information turns out to tell you a lot about the context of their reception.
query_authors = [

    'LE GUIN, Ursula K',
    'MORRISON, Toni',
    'MERTON, Thomas', # Christian monk
    'KENNEDY, Eugene', # Catholic priest
    'UPDIKE, John',
    'ZINN, Howard',
    'BENNETT, Lerone, Jr.', # social historian of race
    'CAUSLEY, Charles', # British children's poet, known for blurring lines between lit for kids/adults
    'SENDAK, Maurice',
    'RICE, Anne',
    'TYLER, Anne',
    'PYNCHON, Thomas'

]

for author in query_authors:
    author_query(weighted, author)
LE GUIN, Ursula K
Top Journal Scores:
Emergency Librarian                        16.177252
New Age Journal                            13.913492
English Journal                            10.664482
Book Report                                10.049862
Magazine of Fantasy and Science Fiction    10.047733
Name: LE GUIN, Ursula K, dtype: float64

Most Similar Authors:
author_name
MC KINLEY, Robin          (0.5528115927876553, 1.4651648937133513e-29)
WALSH, Jill Paton           (0.5264999590498307, 1.70993924355456e-26)
OXENBURY, Helen            (0.5201867871874256, 8.506955391601144e-26)
MC KILLIP, Patricia A      (0.5161226140849589, 2.347997852360038e-25)
ANGELL, Judie            (0.49897481847179126, 1.4699499707507178e-23)
dtype: object

MORRISON, Toni
Top Journal Scores:
Black Scholar    59.835853
Critique         17.461670
Black World      16.720440
Ms.              13.332273
Cresset           6.865729
Name: MORRISON, Toni, dtype: float64

Most Similar Authors:
author_name
DUMAS, Henry               (0.877432209012966, 1.060775142523341e-113)
BAMBARA, Toni Cade          (0.7774150997378938, 1.83205166005727e-72)
ARMAH, Ayi Kwei             (0.775399191524083, 7.295234900612199e-72)
KELLEY, William Melvin     (0.6948979408922896, 4.617259254309341e-52)
RUSSELL, Ross             (0.6921805372380505, 1.6520768255798344e-51)
dtype: object

MERTON, Thomas
Top Journal Scores:
Critic                      18.657915
Christian Century           16.284860
America                     15.183979
Review for Religious        14.616213
Religious Studies Review    13.219459
Name: MERTON, Thomas, dtype: float64

Most Similar Authors:
author_name
KENNEDY, Eugene         (0.7300640514315687, 7.882595309467312e-60)
ORAISON, Marc           (0.7264906275666435, 5.509922558328283e-59)
MC BRIEN, Richard P     (0.7030029994797475, 9.455691139415028e-54)
RAHNER, Kari           (0.7016190526317485, 1.8538772074814077e-53)
DUNNE, John S           (0.6804157544635081, 3.513746567468188e-49)
dtype: object

KENNEDY, Eugene
Top Journal Scores:
America                   21.402213
Review for Religious      20.159124
Christian Century         13.795751
Critic                     8.162939
Educational Leadership     6.553519
Name: KENNEDY, Eugene, dtype: float64

Most Similar Authors:
author_name
RAHNER, Kari                   (0.8624951376463152, 1.4646235674784058e-105)
ORAISON, Marc                    (0.859105639048219, 7.580649865528993e-104)
MORAN, Gabriel                  (0.8530459691211054, 6.839269809942987e-101)
DOHERTY, Catherine De Hueck      (0.8250680099089616, 8.679206626529615e-89)
BOROS, Ladislaus                 (0.8048407340361178, 2.618955188762307e-81)
dtype: object

UPDIKE, John
Top Journal Scores:
National Forum         20.862625
American Spectator     20.330386
Economist. Survey      17.967654
Carleton Miscellany    16.950023
America                16.738537
Name: UPDIKE, John, dtype: float64

Most Similar Authors:
author_name
ROTH, Philip                    (0.6920687692717833, 1.7404852299266676e-51)
VIDAL, Gore                      (0.6760280264425202, 2.433341140069544e-48)
MURDOCH, Iris                    (0.6757987574334349, 2.689782607579344e-48)
WILSON, John Anthony Burgess    (0.6655296508462868, 2.1834279288935234e-46)
MAILER, Norman                  (0.6617532460494826, 1.0528355723236884e-45)
dtype: object

ZINN, Howard
Top Journal Scores:
Negro Digest           13.841505
Science and Society    13.761646
Dissent                12.200907
Social Education        7.624908
Partisan Review         7.167689
Name: ZINN, Howard, dtype: float64

Most Similar Authors:
author_name
SUTHERLAND, Elizabeth      (0.6129807718752314, 1.0676426021917653e-37)
APTHEKER, Herbert           (0.5177429571406121, 1.568975497369954e-25)
EHRENREICH, Barbara         (0.5013228883530935, 8.457594117775939e-24)
RADOSH, Ronald             (0.4797955970028571, 1.1488516111633457e-21)
MOORE, Barrington, Jr.    (0.46729106318539493, 1.7052689919841447e-20)
dtype: object

BENNETT, Lerone, Jr.
Top Journal Scores:
Negro Digest                   27.786328
Black World                    16.720440
Black Scholar                   9.931253
Social Studies                  3.064603
Quarterly Journal of Speech     2.922191
Name: BENNETT, Lerone, Jr., dtype: float64

Most Similar Authors:
author_name
PARKS, Gordon             (0.8886551077709102, 1.4946933078911418e-120)
NKRUMAH, Kwame              (0.8433326831632582, 2.018226499048871e-96)
KELLEY, William Melvin      (0.8061399020139547, 9.214904460798329e-82)
VAN DYKE, Henry             (0.805151484028659, 2.0414253714606717e-81)
CLARKE, John Henrik         (0.7566455147335355, 1.450096864374826e-66)
dtype: object

CAUSLEY, Charles
Top Journal Scores:
Junior Bookshelf                13.393407
Growing Point                    5.389733
School Librarian                 3.774520
New Statesman                    3.678798
Times Educational Supplement     3.387897
Name: CAUSLEY, Charles, dtype: float64

Most Similar Authors:
author_name
BIEGEL, Paul       (0.8797474619943897, 4.664293889661802e-115)
KAYE, Geraldine      (0.822209027770995, 1.129552935901158e-87)
SUDBERY, Rodie      (0.8106722535024123, 2.262449687105018e-83)
LAW, Felicia       (0.8059927740296957, 1.0376161881012245e-81)
PIERS, Helen       (0.7910184049209884, 1.1017670332710154e-76)
dtype: object

SENDAK, Maurice
Top Journal Scores:
New Catholic World     21.840145
Language Arts           7.429803
Instructor              6.625812
Quill and Quire         6.382431
Emergency Librarian     5.309494
Name: SENDAK, Maurice, dtype: float64

Most Similar Authors:
author_name
MINARIK, Else Holmelund     (0.7268228146964074, 4.604771361203391e-59)
WATSON, Wendy               (0.7263598407870459, 5.912879674025634e-59)
BROWN, Margaret Wise        (0.7123824308570459, 8.882268934056061e-56)
KENDALL, Card              (0.6664389620639734, 1.4898139845533964e-46)
MONTRESOR, Beni             (0.6568677963889631, 7.791854945390835e-45)
dtype: object

RICE, Anne
Top Journal Scores:
BooksWest                            6.050889
West Coast Review of Books           3.392710
Ms.                                  3.203419
Village Voice Literary Supplement    2.726607
School Librarian                     1.803452
Name: RICE, Anne, dtype: float64

Most Similar Authors:
author_name
NEFF, Hildegarde    (0.630716460685047, 1.9148479304928843e-40)
WOOD, Bari           (0.6295179554579491, 2.97394593137537e-40)
BARLAY, Stephen      (0.603936258386666, 2.307358441243761e-36)
JAKES, John          (0.5957074972209582, 3.47470700446774e-35)
MARX, Groucho       (0.5926411934038924, 9.358115243413209e-35)
dtype: object

TYLER, Anne
Top Journal Scores:
San Francisco Review of Books    18.637230
Southern Review                  10.844227
Book Report                      10.049862
National Observer                 7.329401
Cresset                           6.865729
Name: TYLER, Anne, dtype: float64

Most Similar Authors:
author_name
OLIVIER, Sir Laurence      (0.621480761776363, 5.422338928703332e-39)
JOHNSON, Diane            (0.6148366403819276, 5.613094201778105e-38)
YURICK, Sol              (0.6116428816970522, 1.6926699397244815e-37)
BECKER, Stephen          (0.5699207473129816, 1.0491605409420453e-31)
MILLS, Hilary              (0.555022258876245, 7.864364546945786e-30)
dtype: object

PYNCHON, Thomas
Top Journal Scores:
Harper's Magazine        7.160074
Saturday Review/World    4.720596
Critique                 4.317086
Prairie Schooner         3.786981
Partisan Review          3.502168
Name: PYNCHON, Thomas, dtype: float64

Most Similar Authors:
author_name
KAUFMAN, Sue         (0.5924577991661754, 9.92606145784547e-35)
BARTH, John        (0.5598444128606803, 1.9914938304178426e-30)
PALEY, Grace         (0.5582812412190425, 3.11604880120294e-30)
MOSTERT, Noel      (0.5195069649305338, 1.0091175318715678e-25)
KOSINSKI, Jerzy     (0.517056759606564, 1.8615545714276522e-25)
dtype: object
The natural next step is to want to see a visualization of the entire space in which authors that have high scores in the same journals are grouped together.
Before doing that, I’m going to create a simple dictionary that associates each author with their top 5 journals. This will be included as a tooltip for that author visible when mousing over their point in the visualization. This is useful just because I have no idea who most of these people are; having their top journals makes them easier to Google, if I encounter them while browsing the visualization.
author_dict = {}
for author in weighted.index:
    top_10 = weighted.loc[author].sort_values(ascending=False)[:5]
    author_dict[author] = top_10.index
There are different ways of producing such a visualization: t-SNE, UMAP, PCA, etc. I’m going to use t-SNE because I’ve used it before. t-SNE tries to find a lower-dimensional projection of the data that retains the local (but not necessarily global) structure of the data.
time_start = time.time()
tsne = TSNE(n_components=2,
            verbose=0,
            perplexity=40,
            n_iter=300,
            learning_rate='auto',
            random_state=11,
            init='pca')
tsne_svd_results = tsne.fit_transform(weighted)
print('t-SNE done! Time elapsed: {} seconds'.format(time.time()-time_start))
/mnt/e/dissertation/ch3/.venv/lib/python3.9/site-packages/sklearn/manifold/_t_sne.py:982: FutureWarning: The PCA initialization in TSNE will change to have the standard deviation of PC1 equal to 1e-4 in 1.2. This will ensure better convergence.
  warnings.warn(


t-SNE done! Time elapsed: 8.81271767616272 seconds
Finally, we’ll make a scatterplot with a mouseover that gives us the name of the author and their top-scoring journals. Authors will tend to be grouped near other authors reviewed by the same venues.
source = ColumnDataSource(data=dict(
    x=tsne_svd_results[:,0],
    y=tsne_svd_results[:,1],
    author=weighted.index,
    top_scores = [author_dict[author] for author in weighted.index],

))
TOOLTIPS = [
    ("(x,y)", "($x, $y)"),
    ("author", "@author"),
    ("top scores", "@top_scores"),
]

p = figure(plot_width=1000, plot_height=800, tooltips=TOOLTIPS, toolbar_location='above',
           title="t-SNE Projection of ~9000 Authors in Book Review Space")
p.scatter('x',
          'y',
          size=7,
          source=source,
          fill_alpha=1,
)

output_file(
    f"../../images/tsne_interactive_{weighting_scheme}.html",
    title=f"t-SNE Projection of {len(weighted.index)} Authors in Book Review Space"
)
Take some time to look it over. You will note that the clusters have a high degree of intuitive structure. Just browsing, I found a cluster of 19th century American authors (Twain, Fennimore Cooper, Melville, etc), a Canadian cluster, a science fiction cluster, and more.